In this page: Digital Twin Model | Resources | Partners
Crop Wild Relatives
The Prototype Biodiversity Digital Twin (pDT) for Crop Wild Relatives is an advanced tool designed to aid in the identification and use of crop wild relatives (CWR) genetic resources to enhance crop resilience against climate-driven stresses. With a rising global population and climate change putting increasing pressure on agricultural production, ensuring food security is a critical challenge to face. Factors such as drought, extreme weather, pests, and crop diseases threaten crop yields. To meet the Sustainable Development Goal 2: Zero Hunger, there is a pressing need for innovative strategies to boost both crop resilience and productivity. One promising solution lies in leveraging the genetic resources of crop wild relatives. Using the MoDGP (Modelling the Germplasm of Interest) tool, this pDT provides detailed maps of geographic areas where stress-tolerant CWR populations can be found. The pDT has user-friendly graphical use interface which offers flexibility in selecting CWR genetic resources to bolster the resilience of various crops against diverse stress factors.
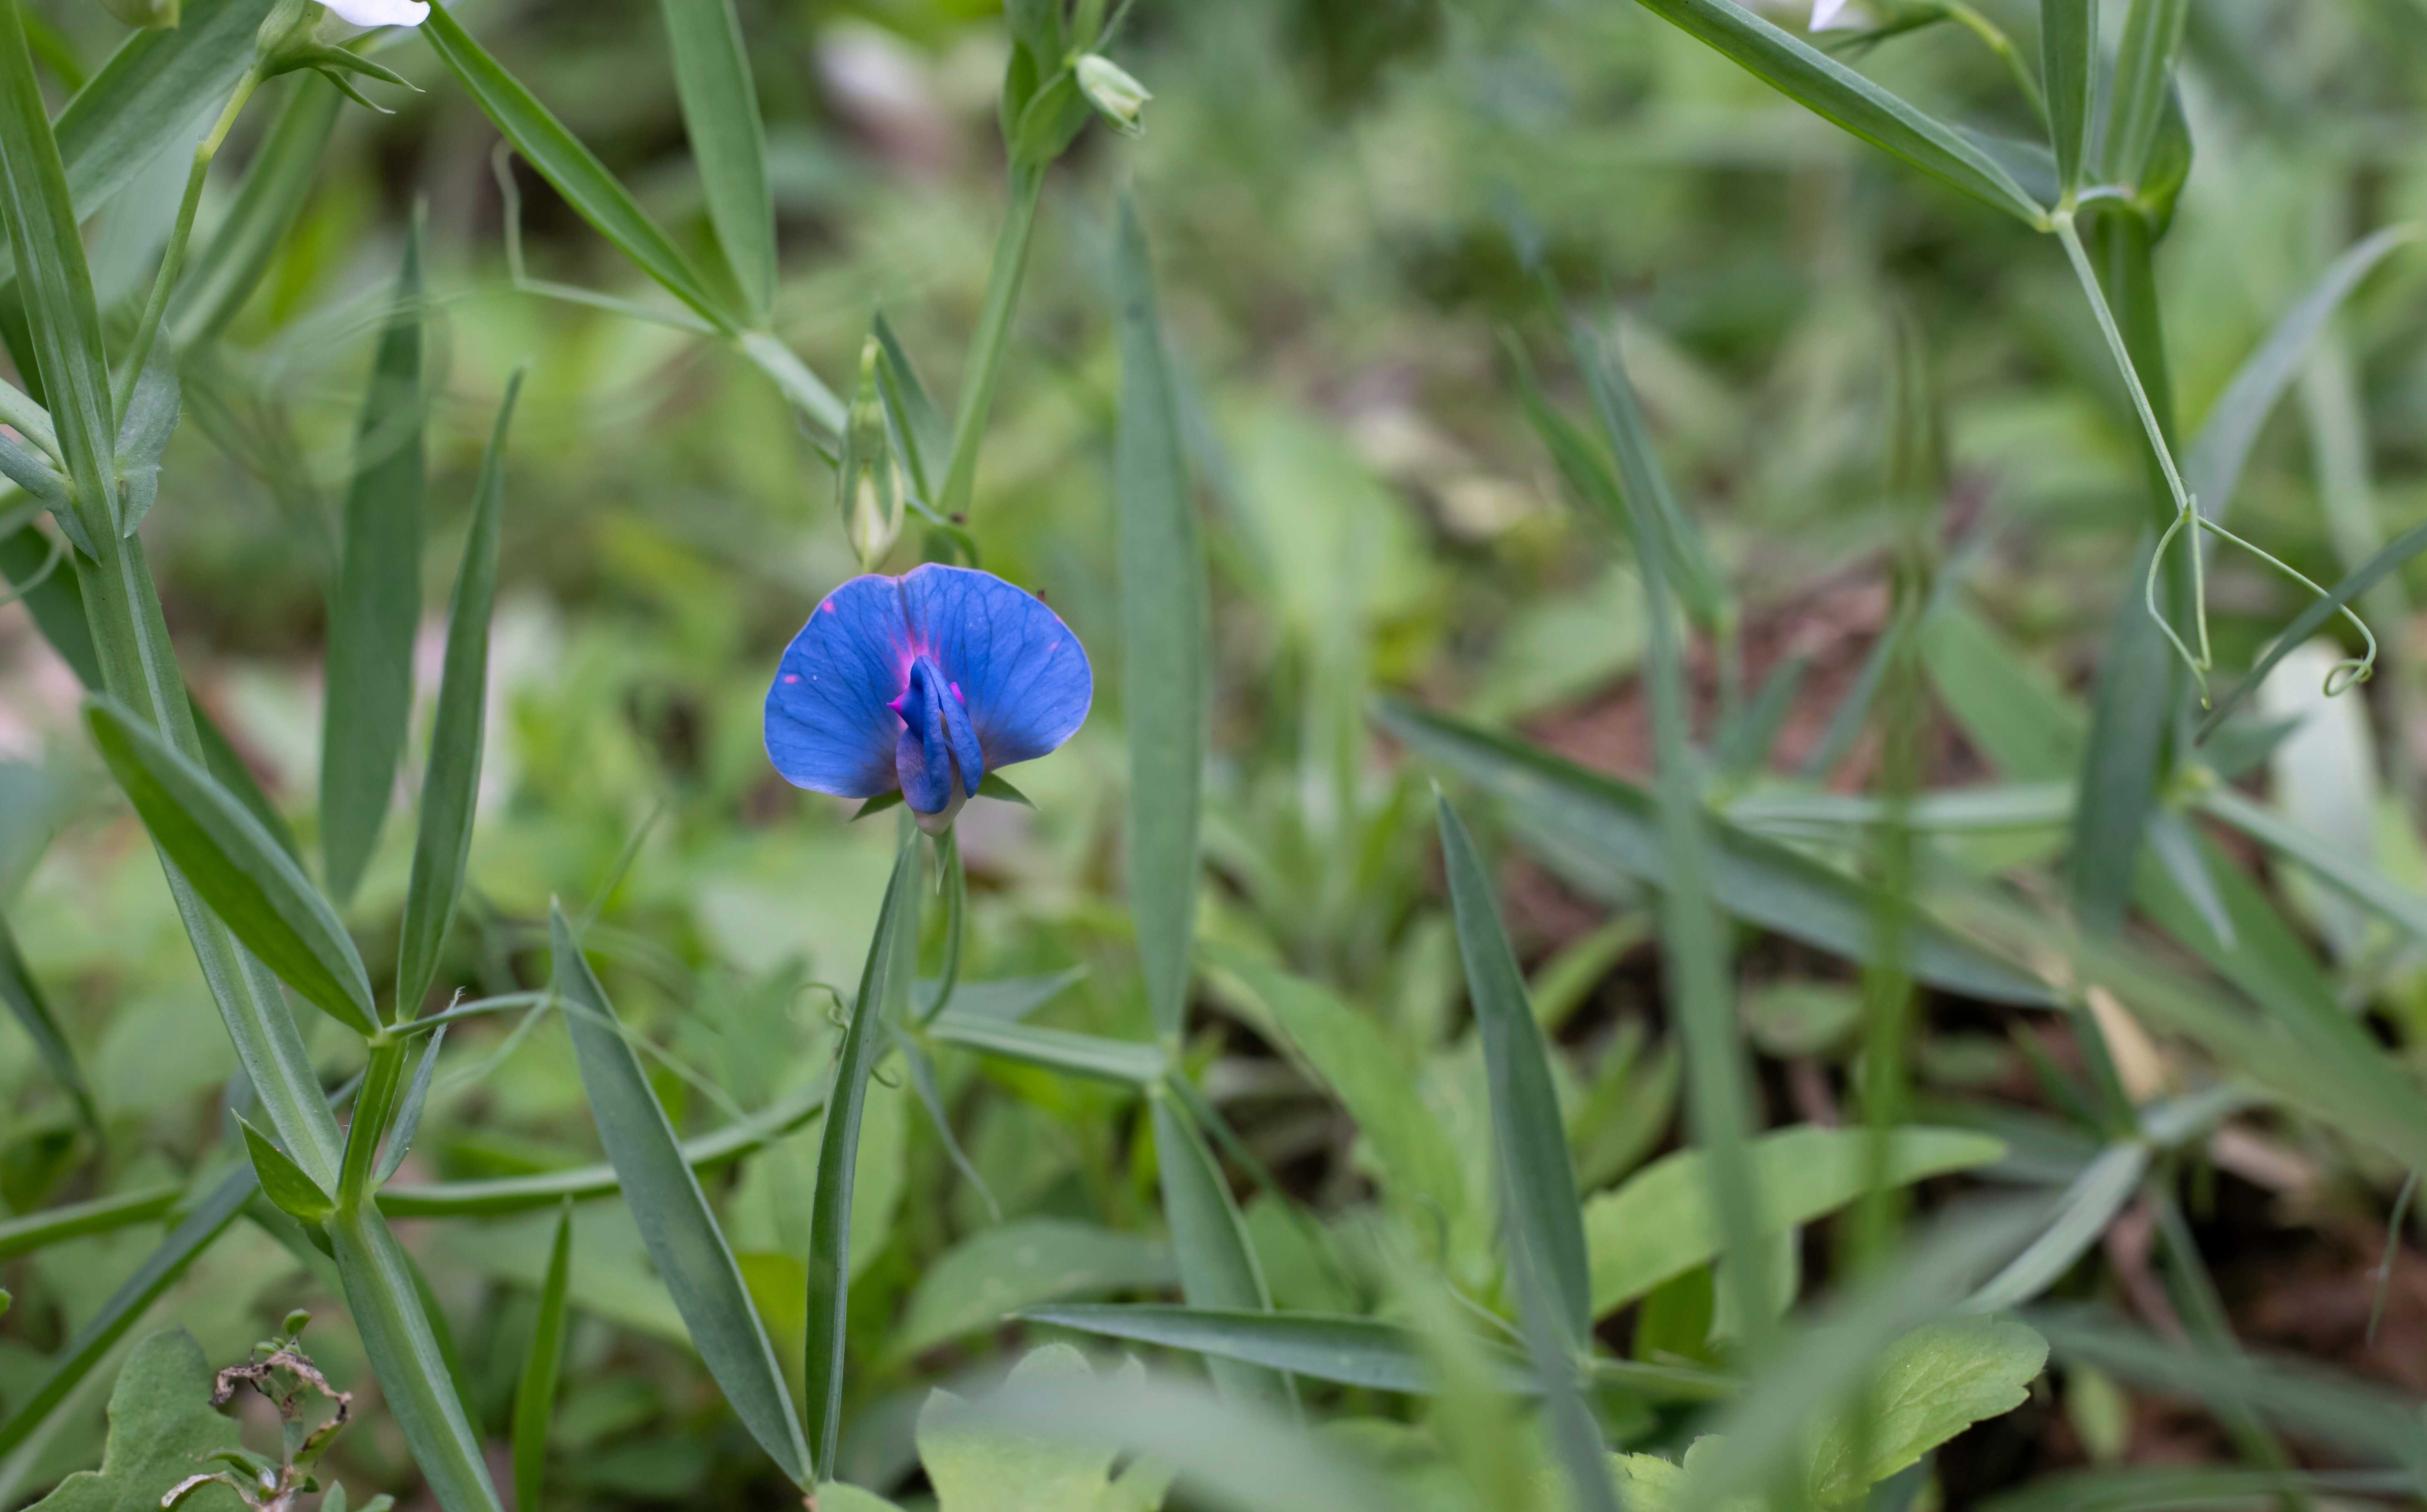
In broad context CWR are wild plants closely related to cultivated crops and include all wild plants within the same genus as the crops. These wild relatives have evolved under various selection pressures, making them valuable sources of novel genetic traits for crop improvement.
*This prototype digital twin is in early access and intended for research purposes only; do not use for decision-making or operational purposes.
Crop Wild Relatives and Digital Twin Models
Modelling and Data
The core of the CWR pDT's modelling capability is the MoDGP tool, which integrates occurrence data and environmental variables to produce habitat suitability maps relying on species distribution modelling algorithms and uses the following data inputs;
Sourced from the Global Biodiversity Information Facility (GBIF) and other repositories such as ICARDA, Genesys PGR, EURISCO, and RAINBIO. These data provide information on the locations of CWR.
Environmental Data such as climate data from ERA5, soil data from SoilGrids, and topographic data from SRTM DEM. These variables are used as predictors in the modelling process.
These data are used as input in high-performing algorithms such as generalised additive modelling (GAM), generalised boosted regression modelling (GBM), and maximum entropy modeling (MaxEnt) to relate occurrence points to environmental variables and generate habitat suitability maps.
Each model is replicated using bootstrapping and data substitution methods. Models are evaluated using AUC and True Skill Statistics (TSS), with only high-performing models retained.
Who can use the pDT?
The CWR pDT interface, developed using R Shiny, offers a user-friendly platform for stakeholders. Users can access dropdown menus to select crops, wild relatives, habitat suitability maps, and abiotic stress ranges. The interface then allows users to map the overlap between environmental stress factors and habitat suitability to identify areas where resilient CWR populations may thrive. Users can constrain or relax tolerance thresholds and prioritise populations for testing based on quality and accessibility.


